Structural insights into the GTP-driven monomerization and activation of a bacterial LRRK2 homolog using allosteric nanobodies
- Structural Biology Brussels, Vrije Universiteit Brussel, Belgium
- VIB-VUB Center for Structural Biology, VIB, Belgium
- German Center for Neurodegenerative Diseases, Germany
- Institute for Ophthalmic Research, Center for Ophthalmology, University of Tübingen, Germany
Figures
Figure 1 with 5 supplements
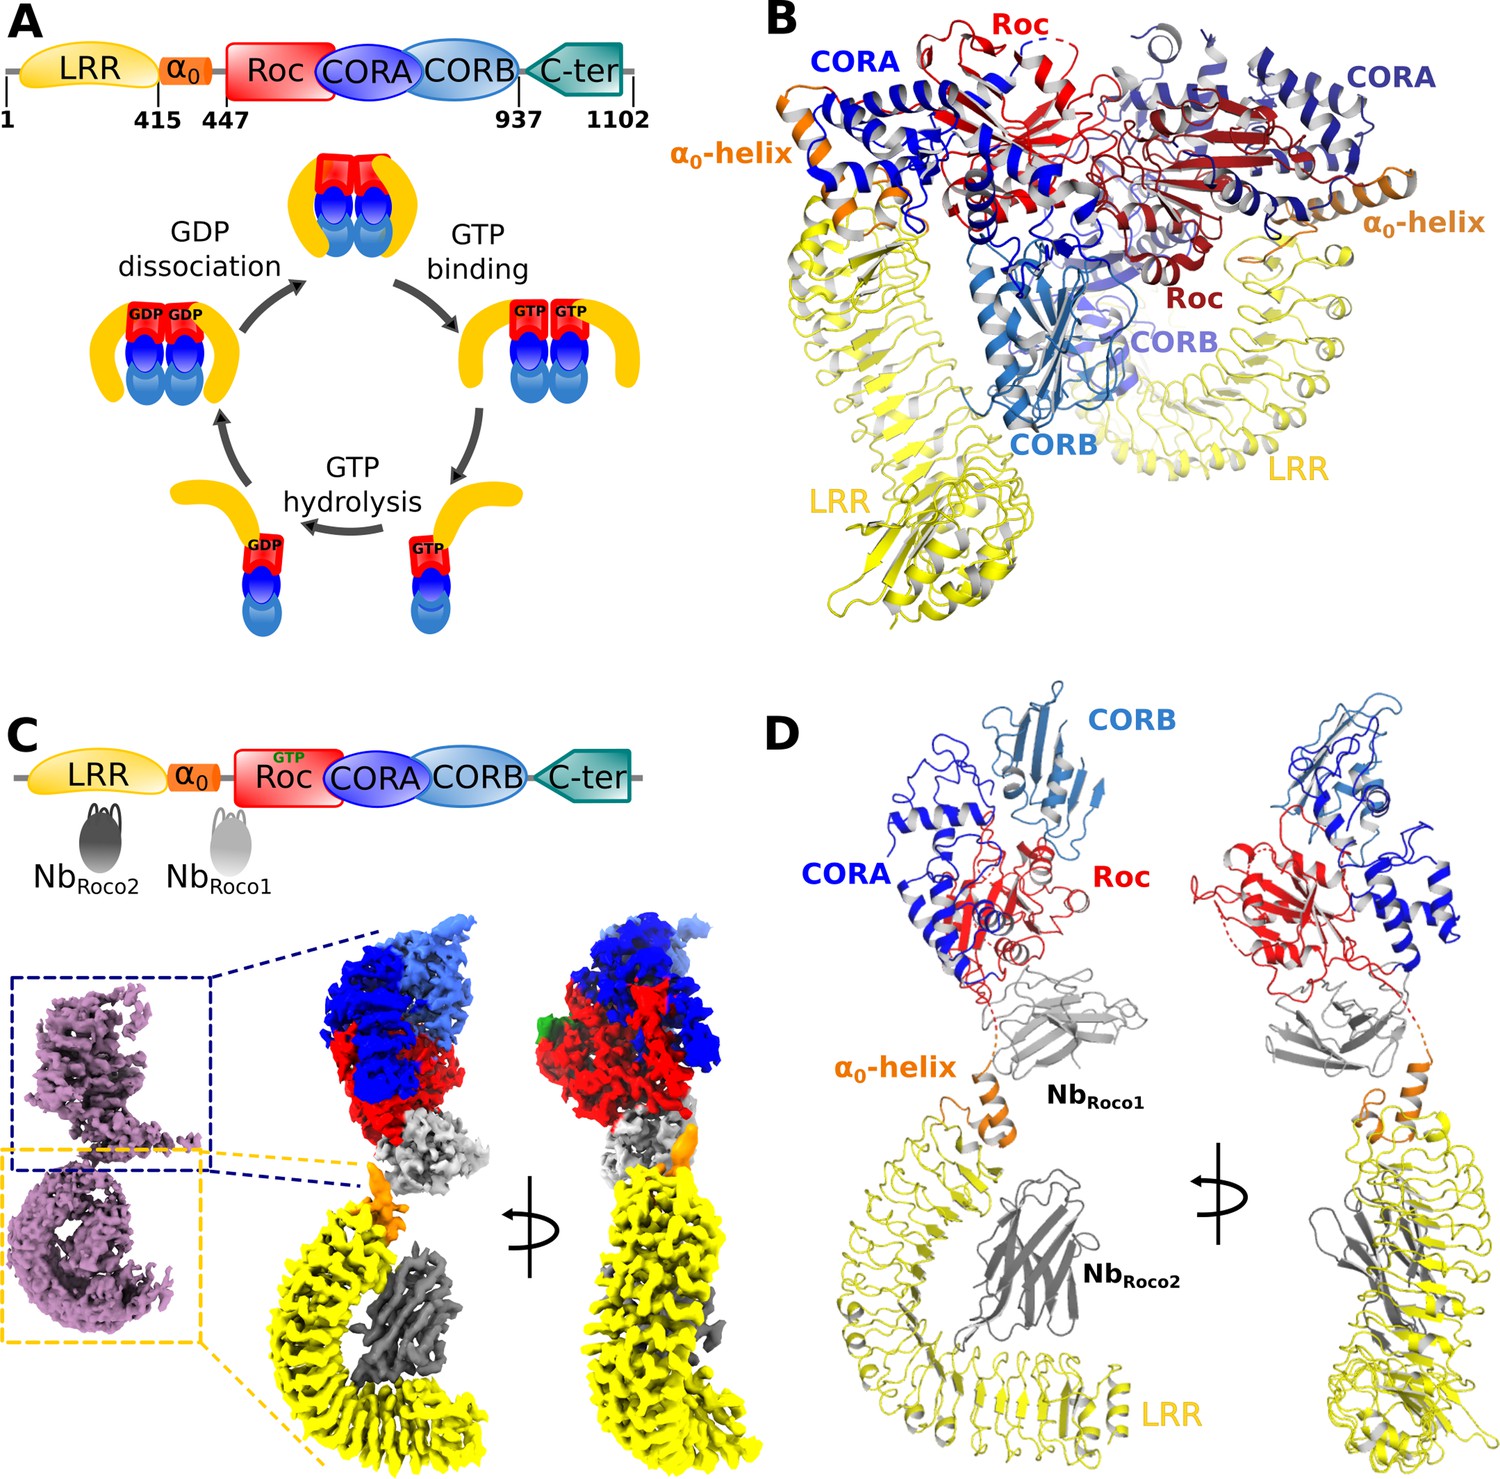
Nucleotide-induced conformational changes in CtRoco.
(A) Schematic representation of the domain arrangement of CtRoco (top) and its anticipated conformational cycle linked to GTP binding and hydrolysis (bottom) (Deyaert et al., 2017b). (B) The previously published crystal structure of nucleotide-free CtRoco showing the protein as a compact homodimer, where the LRR domains fold back on the Roc-COR domains (PDB: 6hlu) (Deyaert et al., 2019). (C) NbRoco1 and NbRoco2 specifically bind to the CtRoco monomer in its ‘GTP state’ (top) (Leemans et al., 2020). The cryo-electron microscopy (cryo-EM) map of GTPγS-bound full-length CtRoco in complex with NbRoco1 and NbRoco2 at 7.7 Å resolution shows an elongated monomeric arrangement (bottom left). A composite map, obtained by superposing the individual cryo-EM maps focused on the C-terminal (3.9 Å) and N-terminal (3.6 Å) part of the protein, was generated (bottom right). This map is colored according to the corresponding domains and Nbs. (D) Final model of CtRoco-NbRoco1-NbRoco2 based on the maps shown in (C).
Figure 1—figure supplement 1
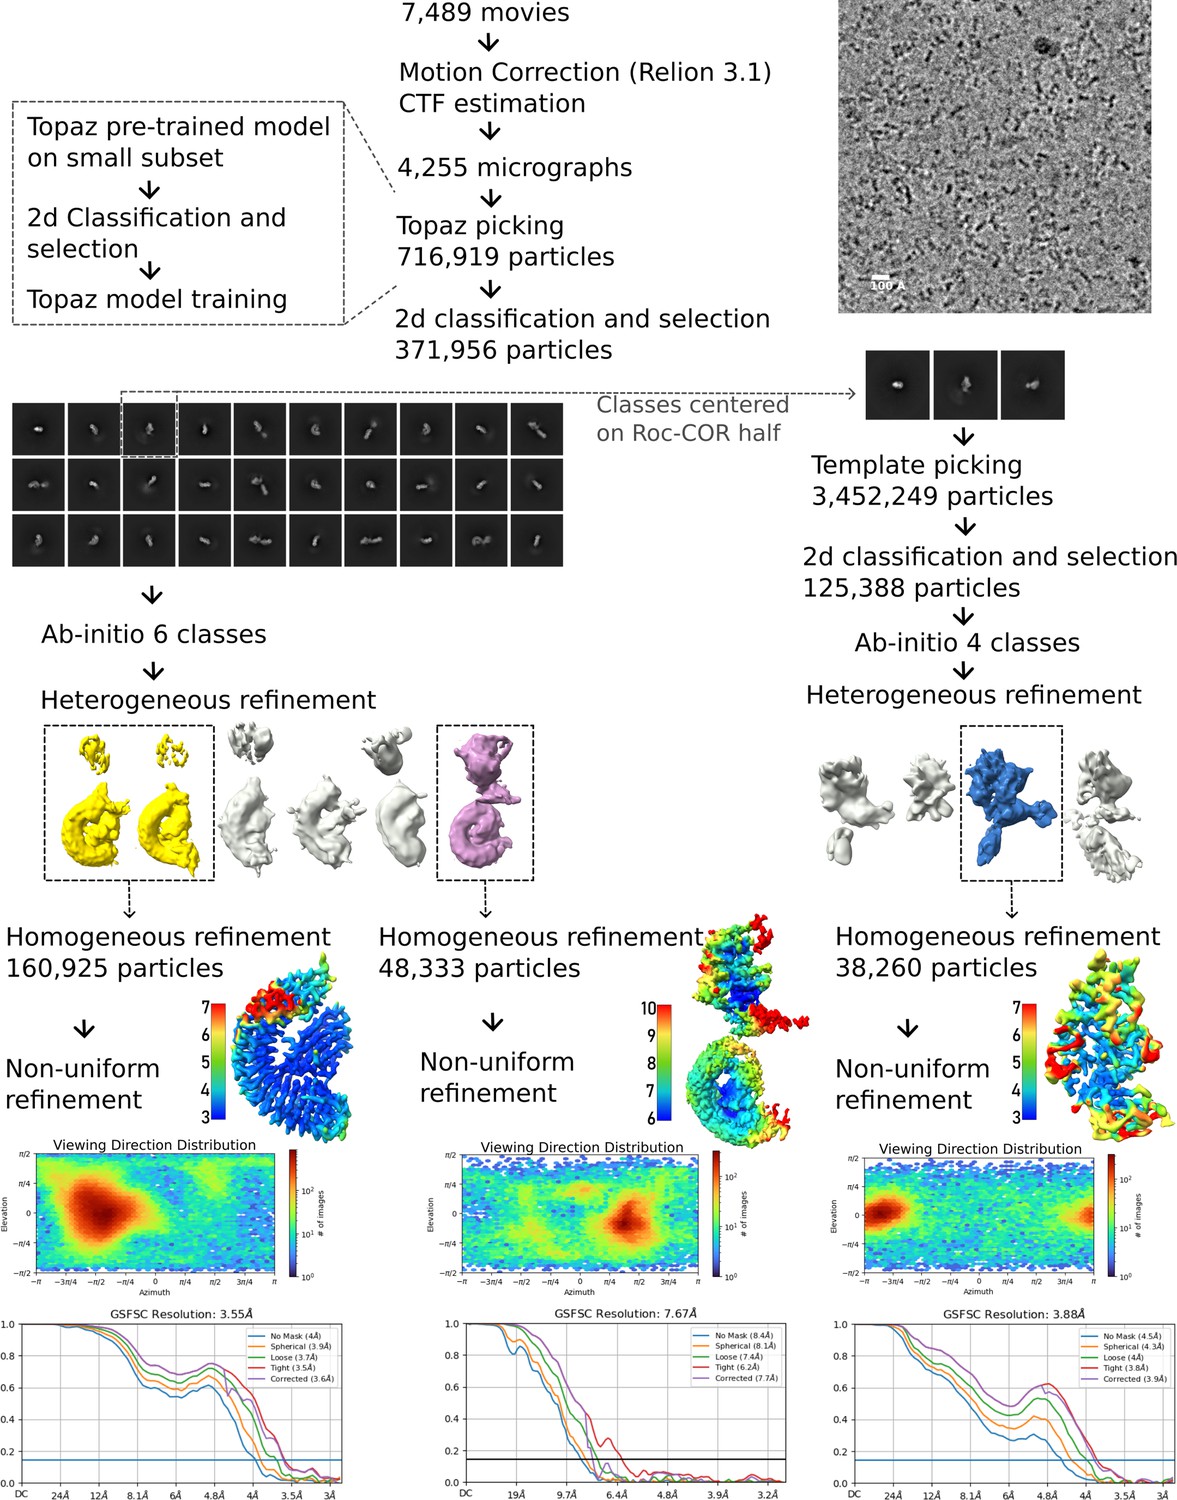
Cryo-electron microscopy (cryo-EM) workflow to obtain the maps corresponding to CtRoco-NbRoco1-NbRoco2.
Flow chart of the cryo-EM data processing, including 2D and 3D classifications, focused map strategies and density map reconstructions. Local resolution maps, Fourier shell correlation (FSC) curves, particle distribution plots, and cryo-EM density maps are also shown. Unless otherwise stated, all analyses were performed using cryoSPARC v3.3. Details are provided in the ‘Materials and methods’ section.
Figure 1—figure supplement 2

Cryo-electron microscopy (cryo-EM) workflow to obtain the map corresponding to CtRoco-NbRoco1.
Flow chart of the cryo-EM data processing, including 2D and 3D classifications and density map reconstructions. Local resolution map, Fourier shell correlation (FSC) curve, particle distribution plot, and cryo-EM density map are also shown. Unless otherwise stated, all analyses were performed using cryoSPARC v3.3. Details are provided in the ‘Materials and methods’ section.
Figure 1—figure supplement 3

2D classification of CtRoco-NbRoco1-NbRoco2 (representative classes).
(A) 2D classes from particles extracted in a box size of 384 Å. Only some of these classes display the full particle, most are centered on one half of the protein showing blurred density for the rest of the particle. (B) Selected classes displaying the pull particle. (C) 2D classes from particles selected for a focused map centered on the LRR domain, extracted in a box size of 243 Å. Blurred density for the rest of the particle is also visible. (D) 2D classes from particles selected for a focused map centered on the Roc-COR domains, extracted in a box size of 243 Å. Blurred density for the rest of the particle is also visible.
Figure 1—figure supplement 4

Quality of the cryo-electron microscopy (cryo-EM) map of CtRoco-NbRoco1-NbRoco2.
(A) Map focused on the N-terminal (LRR) domain in complex with NbRoco2. The inset shows a zoom-in on the NbRoco2 binding region. (B) Mesh representation of the cryo-EM map around the nucleotide-binding region of the Roc domain (left) and around the bound GTPγS molecule (right). (C) Cryo-EM map around NbRoco1 in two orientations. The CDR loops are highlighted in brown (CDR1), green (CDR2), and magenta (CDR3).
Figure 1—figure supplement 5

Fourier shell correlation (FSC) plots of refined atomic models against the focused cryo-electron microscopy (cryo-EM) density maps of CtRoco-NbRoco1-NbRoco2.
(A) Fourier shell correlation (FSC) plot of refined LRR-NbRoco2 model. The resolution at which the FSC curve drops below 0.5 is indicated. (B) FSC plot of refined Roc-COR-NbRoco1 model. The resolution at which the FSC curve drops below 0.5 is indicated.
Figure 2 with 3 supplements
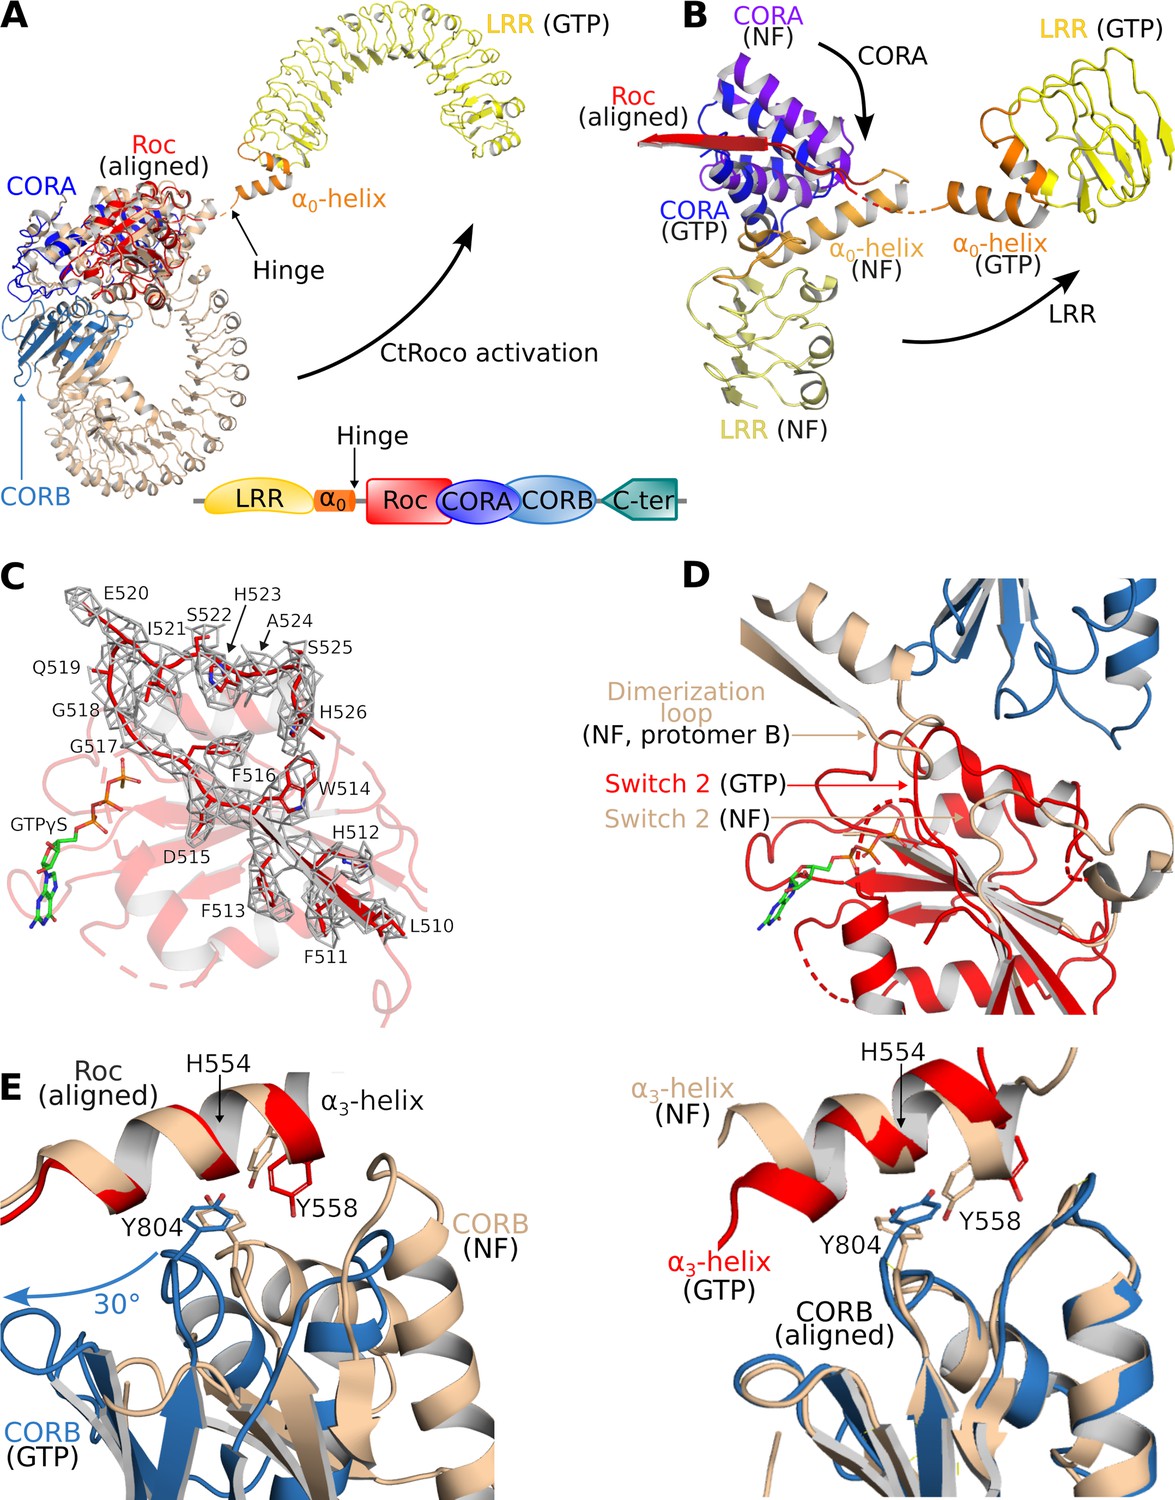
Structural changes occurring upon GTP-driven CtRoco activation.
(A) Superposition of a subunit of the nucleotide-free CtRoco dimer (labeled ‘NF’; beige) and the GTPγS-bound monomeric CtRoco-NbRoco1-NbRoco2 (labeled ‘GTP’, colored by domain). The Roc domains of both structures were used for the superposition. Nbs were removed in the representation of CtRoco-NbRoco1-NbRoco2 for clarity. The conformational change occurring in the LRR domain and α0-helix is indicated by an arrow. (B) Close-up view of the displacement of the LRR, α0-helix and CORA upon CtRoco activation. The position of CORA in the ‘GTP’ conformation is incompatible with the position of the α0-helix in the nucleotide-free conformation, providing a mechanism to relay conformational changes from Roc and CORA toward the α0-helix and LRR domain. The LRR, α0, and CORA of nucleotide-free and GTPγS-bound CtRoco are colored in different shades of yellow, orange, and blue, respectively. (C) Mesh representation of the cryo-electron microscopy (cryo-EM) map around the Switch 2 region and the preceding β-strand in the GTPγS-bound Roc domain. (D) Superposition of Roc domains and surrounding regions of nucleotide-free (beige) and GTPγS-bound CtRoco (colored according to domain). The conformation of the Switch 2 region in GTPγS-bound CtRoco would sterically clash with the ‘dimerization loop’ of the adjacent protomer of the nucleotide-free dimer, providing an initial trigger for nucleotide-induced monomerization. (E) Upon activation, the CORB domain of GTPγS-bound CtRoco (blue) displays a 30° rotational movement with regard to corresponding domain of nucleotide-free CtRoco (beige). The H554-Y558-Y804 triad (corresponding to N1437-R1441-Y1699 in LRRK2), located at the Roc-CORB interface, acts as a hinge point for this rotational movement. Left: view of a superposition using the Roc domain; right: view of a superposition using the CORB domain.
Figure 2—figure supplement 1

The α0-helix is inserted between the LRR and CORA domains in the nucleotide-free CtRoco structure.
Zoomed-in view of the α0-helix of nucleotide-free CtRoco (PDB: 6hlu), with the LRR, α0, Roc, and CORA domains colored in yellow, orange, red, and blue, respectively. Selected amino acids are shown as sticks with polar interactions indicated by black dashes.
Figure 2—figure supplement 2
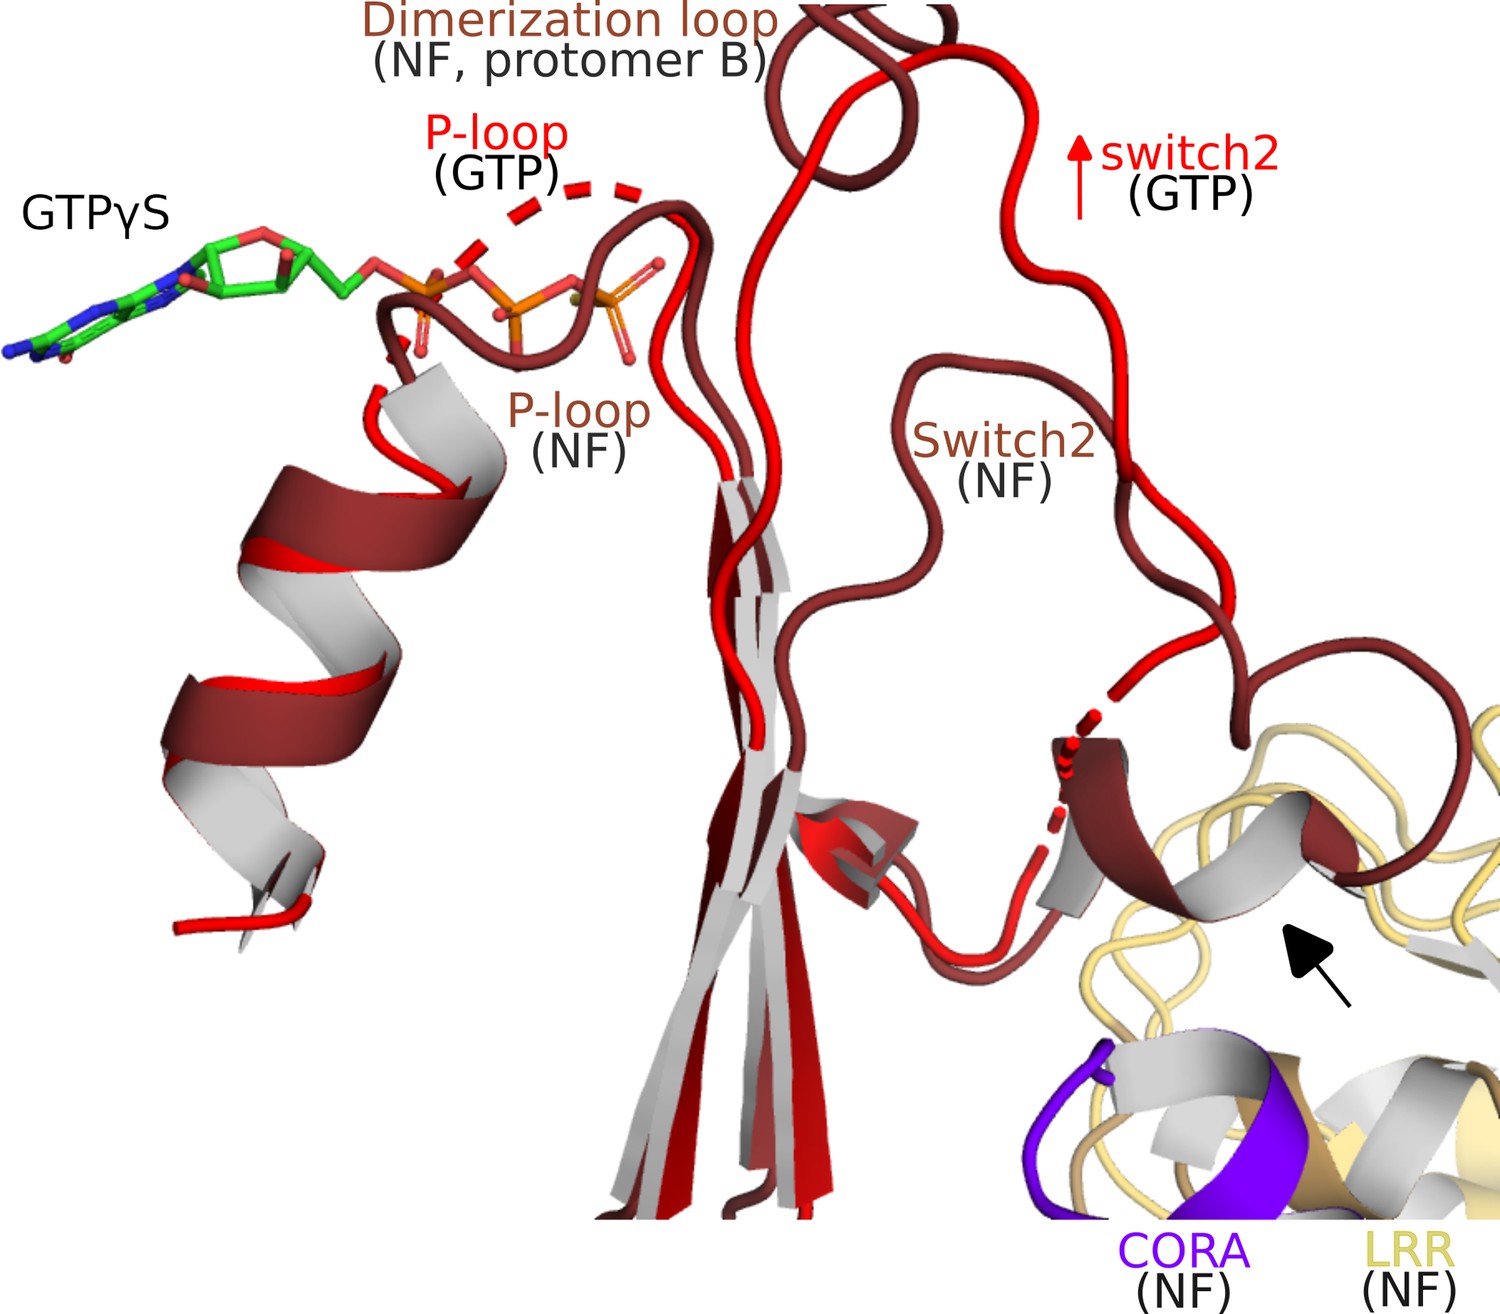
Structural changes within the Roc domain and the LRR-Roc-CORA interface upon GTPγS binding.
In the nucleotide-free CtRoco dimer, the position of the P-loop is stabilized by the dimer interface and dimerization loop. This P-loop conformation would interfere with nucleotide (GTP) binding. Upon GTPγS binding a change in P-loop conformation is observed, together with a rearrangement of the Switch 2 to a position that would sterically clash with the dimerization loop of the adjacent subunit (indicated with a red arrow). Together these rearrangements will trigger CtRoco monomerization. These conformational changes in Switch 2 can also be relayed to the LRR, α0-helix, and CORA regions through the C-terminal part of Switch 2 (indicated with a black arrow).
Figure 2—figure supplement 3

The rotational movement of the CORB domain upon GTP-driven CtRoco activation induces monomerization.
Superposition (on the Roc domain) of a GTPγS-bound CtRoco monomer (‘GTP’; colored by domain) on the nucleotide-free CtRoco dimer (‘NF’, beige). Only the CORB domain of the superposed subunit of nucleotide-free CtRoco is shown for clarity. The rotational movement of the CORB domain upon GTPγS binding would cause sterical clashes with the Roc domain of the adjacent protomer of nucleotide-free CtRoco (brick red), providing a mechanism for monomerization.
Figure 3
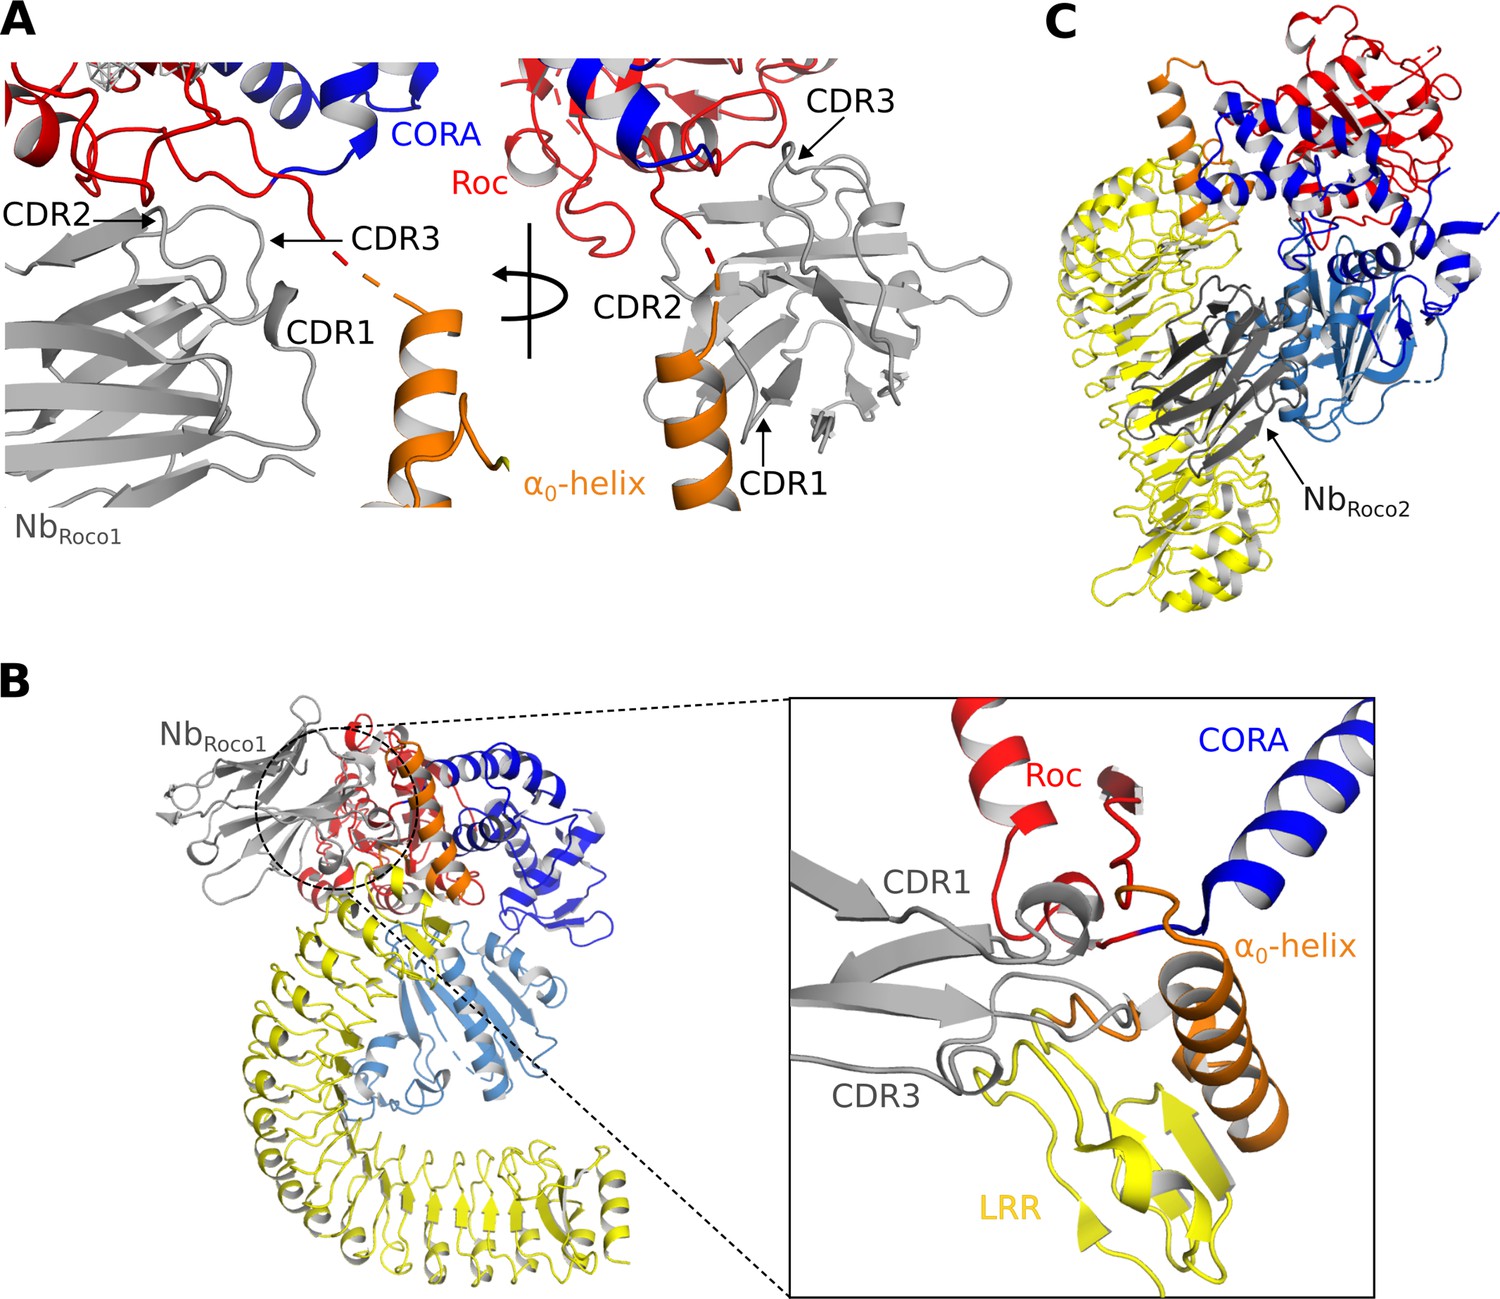
Mechanisms of the allosteric activation of CtRoco by NbRoco1 and NbRoco2.
(A) NbRoco1 binds at the interface of the Roc, CORA, and LRR domains, close to the α0-helix and the hinge region of the LRR movement. (B) Superposition of NbRoco1 on the conformation adopted by the nucleotide-free CtRoco shows considerable sterical clashes between the CDR1 and CDR3 regions of NbRoco1 and the LRR domain and α0-helix of nucleotide-free CtRoco (see inset). This provides a mechanism for the NbRoco1-mediated stabilization of CtRoco in its GTP-bound active conformation. (C) Superposition of NbRoco2 on the conformation adopted by the nucleotide-free CtRoco shows that the position of NbRoco2 in the curvature of the LRR domain is not compatible with the closed conformation of CtRoco, due to severe sterical clashes with the CORB domain.
Figure 4 with 1 supplement
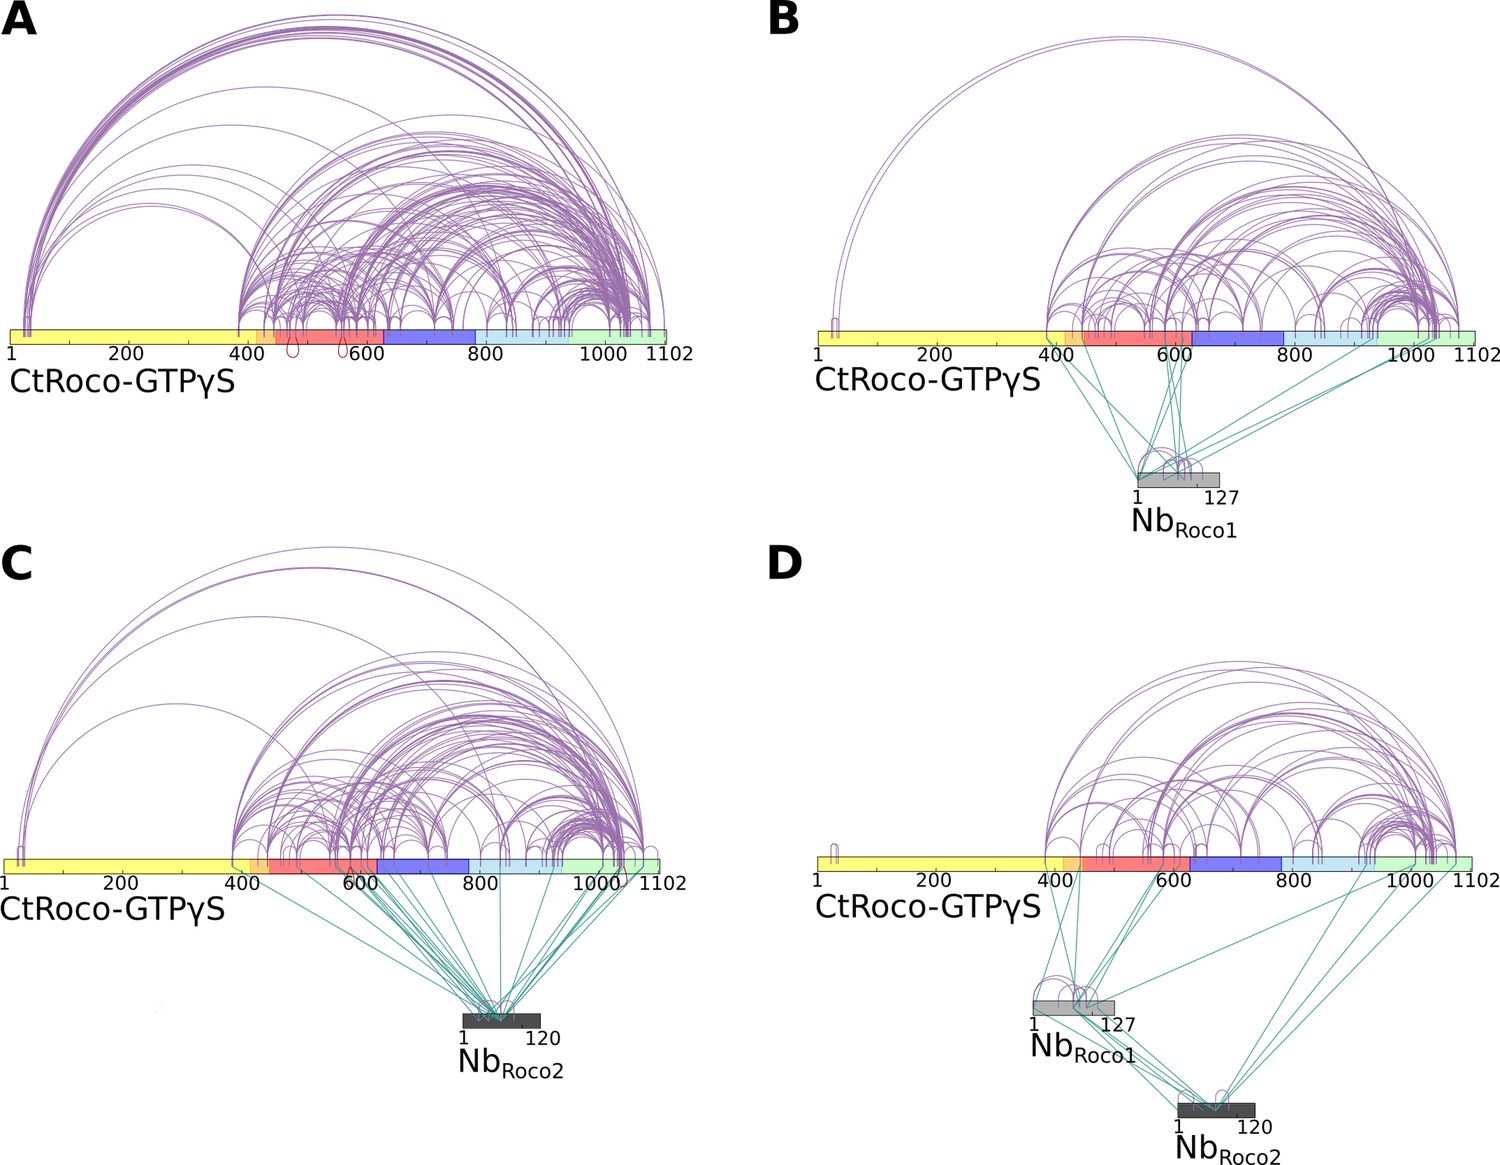
Crosslinking mass spectrometry (CX-MS) experiments show the stabilization of GTPγS-bound CtRoco in its elongated active conformation by NbRoco1 and/or NbRoco2.
(A) Intramolecular disuccinimidyl sulfoxide (DSSO)-crosslinks within GTPγS-bound CtRoco in the absence of nanobodies. (B) Effect of NbRoco1 on the intramolecular DSSO-crosslinks within GTPγS-bound CtRoco. The intermolecular crosslinks between CtRoco and NbRoco1 are also shown. (C) Effect of NbRoco2 on the intramolecular DSSO-crosslinks within GTPγS-bound CtRoco. The intermolecular crosslinks between CtRoco and NbRoco2 are also shown. (D) Effect of the combination of NbRoco1 and NbRoco2 on the intramolecular DSSO-crosslinks within GTPγS-bound CtRoco. The intermolecular crosslinks between CtRoco, NbRoco1, and NbRoco2 are also shown.
Figure 4—figure supplement 1
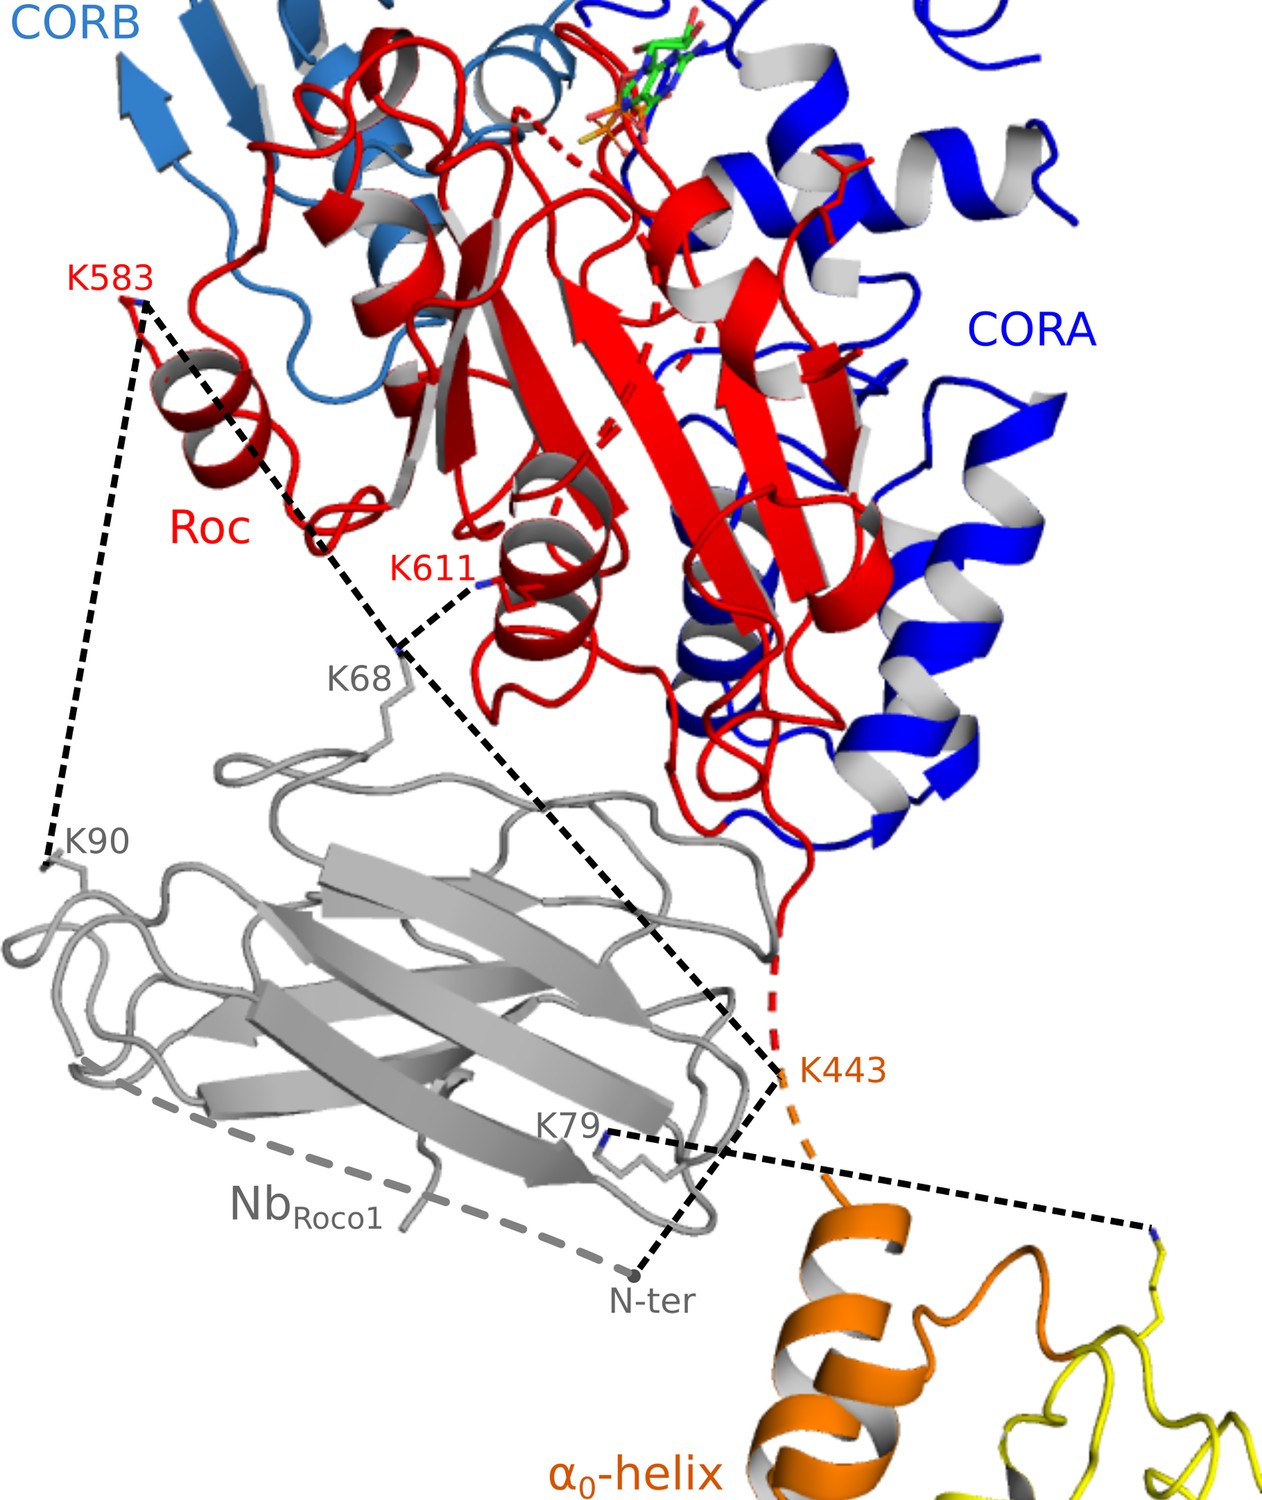
Observed crosslinks between NbRoco1 and CtRoco.
The intermolecular DSSO-crosslinks formed between NbRoco1 and CtRoco bound to GTPγS, NbRoco1, and NbRoco2 are indicated on the CtRoco-NbRoco1-NbRoco2 structure as dashes. Lysine side chains involved in crosslinking are shown as sticks (when modeled in the CtRoco-NbRoco1-NbRoco2 structure).
Figure 5
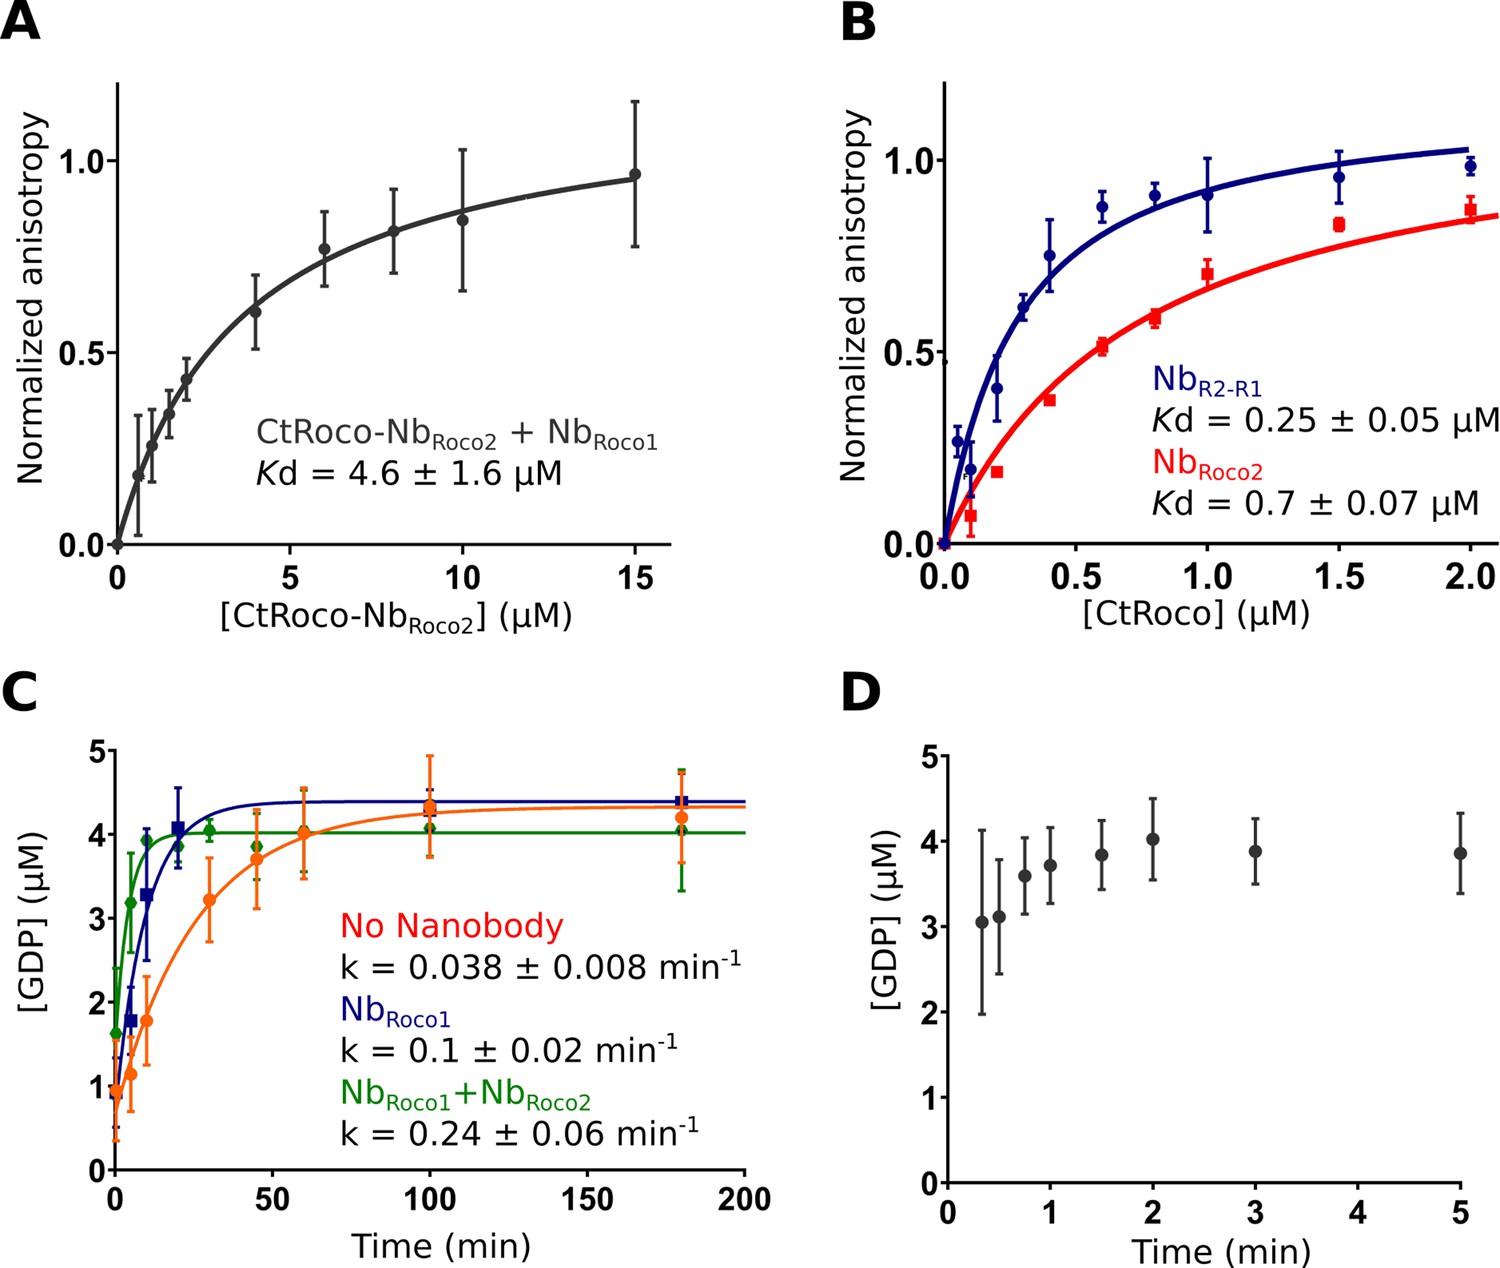
NbRoco1 and NbRoco2 have a synergistic effect on CtRoco activation that is potentiated by the bivalent nanobody construct NbR2-R1.
(A) NbRoco2 enables the binding of NbRoco1 to the nucleotide-free CtRoco. The fluorescence anisotropy signal of the FITC-labeled NbRoco1 is monitored upon titration with increasing concentrations of nucleotide-free CtRoco in the presence of an excess of NbRoco2. The equilibrium dissociation constant (Kd ± standard error), obtained by fitting of triplicated data with a quadratic binding equation, is given. (B) NbR2-R1 has a threefold increased affinity toward nucleotide-free CtRoco in comparison to NbRoco2. FITC-labeled NbR2-R1 or NbRoco2 were titrated with nucleotide-free CtRoco, and fluorescence anisotropy data was analyzed as in (A). (C) Single turnover GTP (5 µM) hydrolysis rate of CtRoco-L487A (5 µM) in the absence of nanobodies (orange), or in the presence of either NbRoco1 (blue) or both NbRoco1 and NbRoco2 (green). (D) Single turnover GTP (5 µM) hydrolysis of CtRoco-L487A (5 µM) in the presence of NbR2-R1, all GTP was converted within the dead time (20 s) of the experiment.
Figure 6
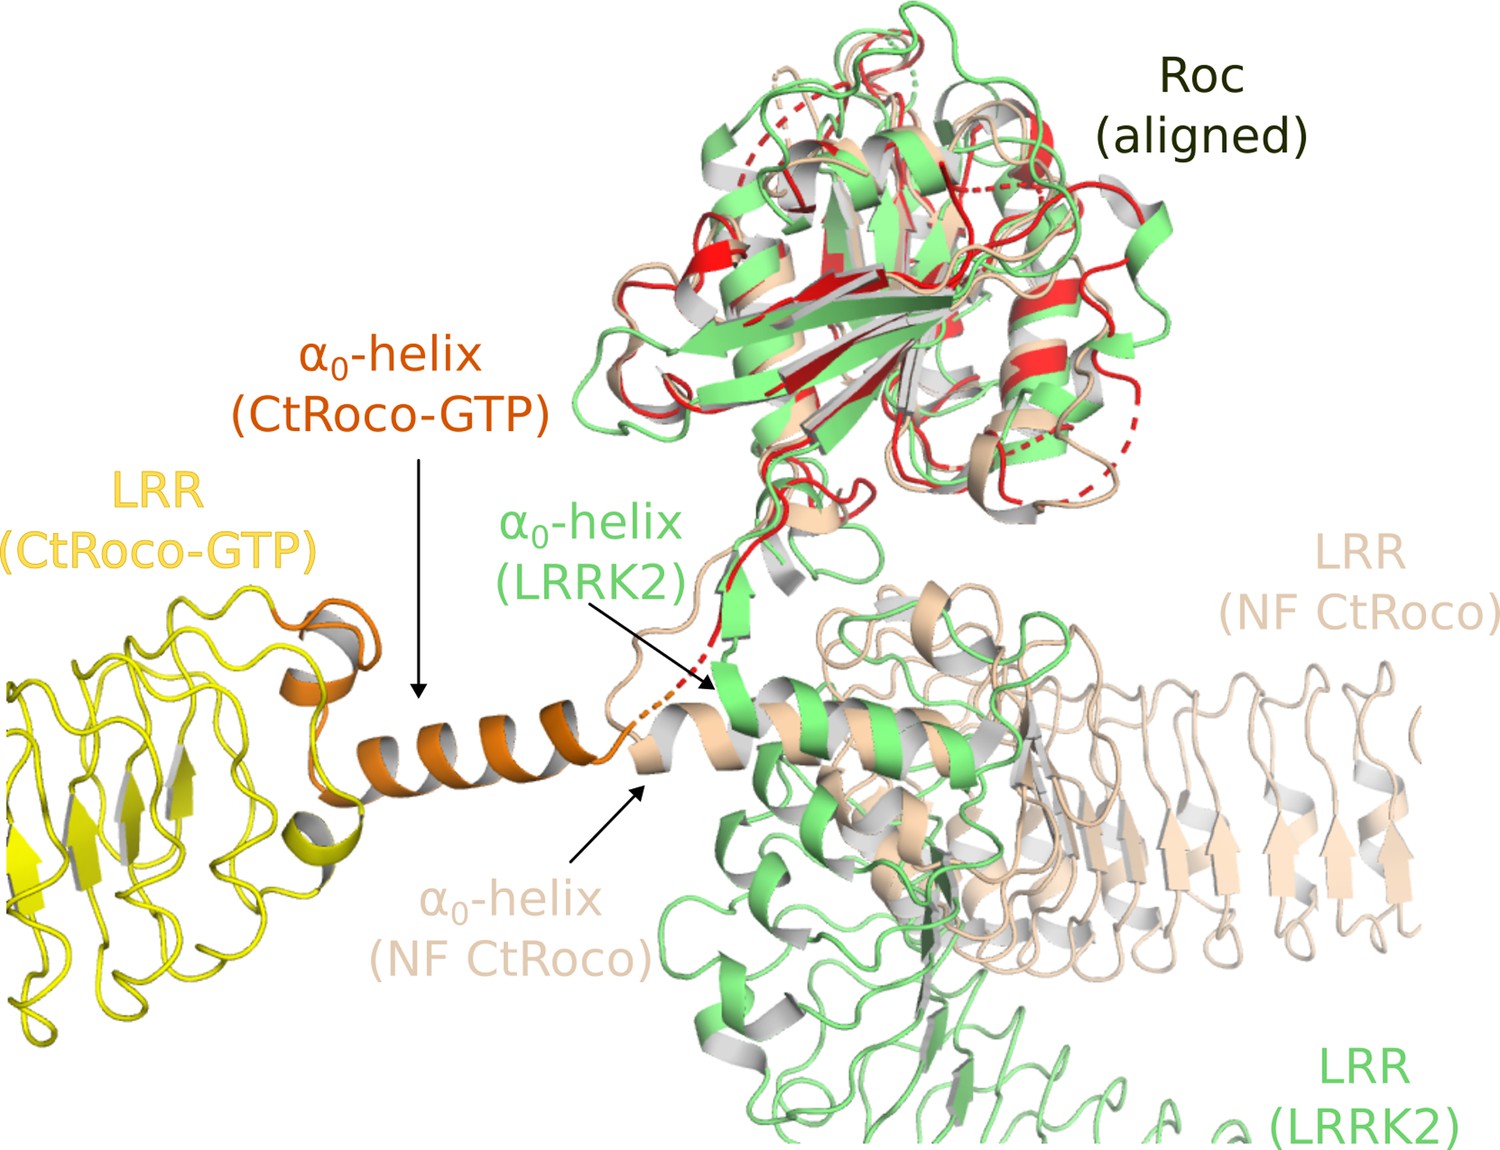
Similarities in the activation mechanisms of CtRoco and LRRK2.
A comparison of the conformation of the LRR domain and the α0-helix adopted within GTPγS-bound CtRoco-NbRoco1-NbRoco2 (this work, colored by domain), nucleotide-free CtRoco (beige) (PDB: 6hlu) (Deyaert et al., 2019), and GDP-bound LRRK2 (green) (PDB: 7lhw) (Myasnikov et al., 2021) is shown. The Roc domain of the three structures was used for the superposition.
Author response image 1

Tables
Table 1
Cryo-electron microscopy (cryo-EM) data collection, refinement, and validation statistics.
| CtRoco-NbRoco1-NbRoco2 | CtRoco-NbRoco1-NbRoco2 (LRR focused) | CtRoco-NbRoco1-NbRoco2 (Roc-COR focused) | CtRoco-NbRoco1 | |
|---|---|---|---|---|
| Data collection | ||||
| Microscope | CryoARM300 | CryoARM300 | ||
| Voltage (keV) | 300 | 300 | ||
| Electron exposure (e-/Å2) | 63 | 63 | ||
| Energy filter slit width | 20 eV | 20 eV | ||
| Detector | Gatan K3 | Gatan K3 | ||
| Magnification | × 60,000 | × 60,000 | ||
| Defocus range (μm) | 1–3 | 1–3 | ||
| Pixel size (Å/pix) | 0.755 | 0.766 | ||
| Number of movies | 7489 | 11,718 | ||
| Symmetry | C1 | C1 | ||
| Final particles | 48,333 | 160,925 | 38,260 | 99,460 |
| Map mean resolution (Å) | 7.7 | 3.6 | 3.9 | 8.3 |
| Model refinement | ||||
| Atoms | 4038 | 3573 | ||
| Bonds (RMSD) | ||||
| Bond length (Å) | 0.004 | 0.003 | ||
| Bond angles (°) | 0.749 | 0.647 | ||
| Validation | ||||
| Clash score | 13.09 | 12.94 | ||
| Rotamer outliers (%) | 0.7 | 0.3 | ||
| MolProbity score | 2.15 | 2.18 | ||
| Ramachandran plot | ||||
| Favored (%) | 88.57 | 89.78 | ||
| Allowed (%) | 11.25 | 9.57 | ||
| Outlier (%) | 0.18 | 0.65 | ||
| Mean B-factors | ||||
| Protein | 45.93 | 37.13 | ||
| Ligand | 39.20 | |||
Additional files
Download links
A two-part list of links to download the article, or parts of the article, in various formats.
Downloads (link to download the article as PDF)
Open citations (links to open the citations from this article in various online reference manager services)
Cite this article (links to download the citations from this article in formats compatible with various reference manager tools)
Structural insights into the GTP-driven monomerization and activation of a bacterial LRRK2 homolog using allosteric nanobodies
eLife 13:RP94503.
https://doi.org/10.7554/eLife.94503.3


